The Q4 2024 – Q1 2026 Pulse data reveals a divergence across member firms: hours-based utilization has remained stable, while the revenue quality of those hours has quietly declined. Here’s a closer look at what the numbers suggest, based on data from 24 integrators.
Key Metrics at a Glance
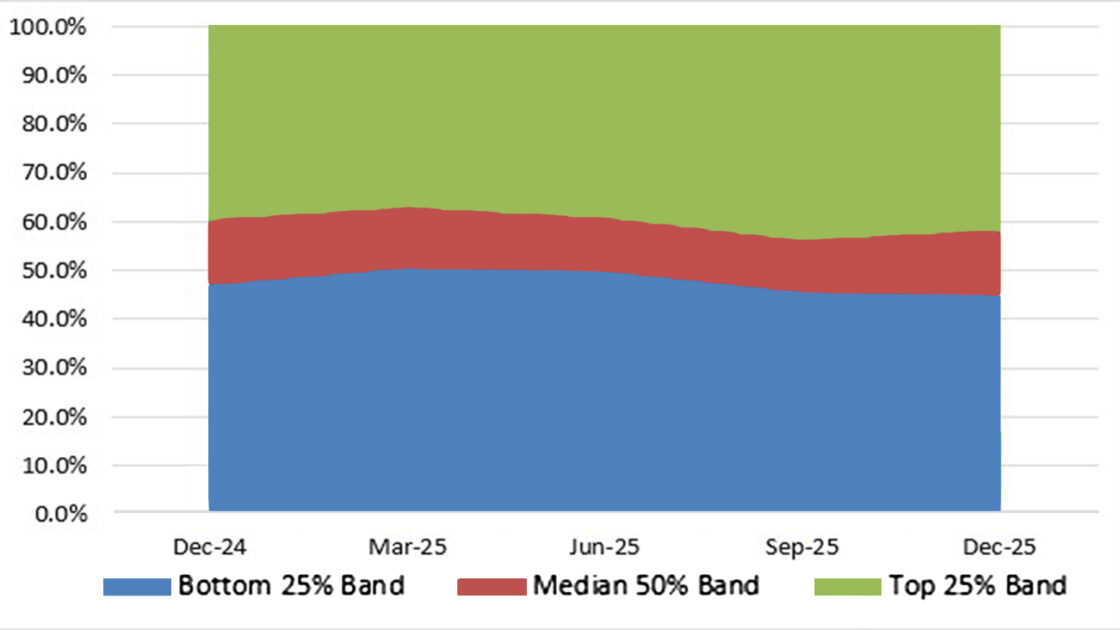
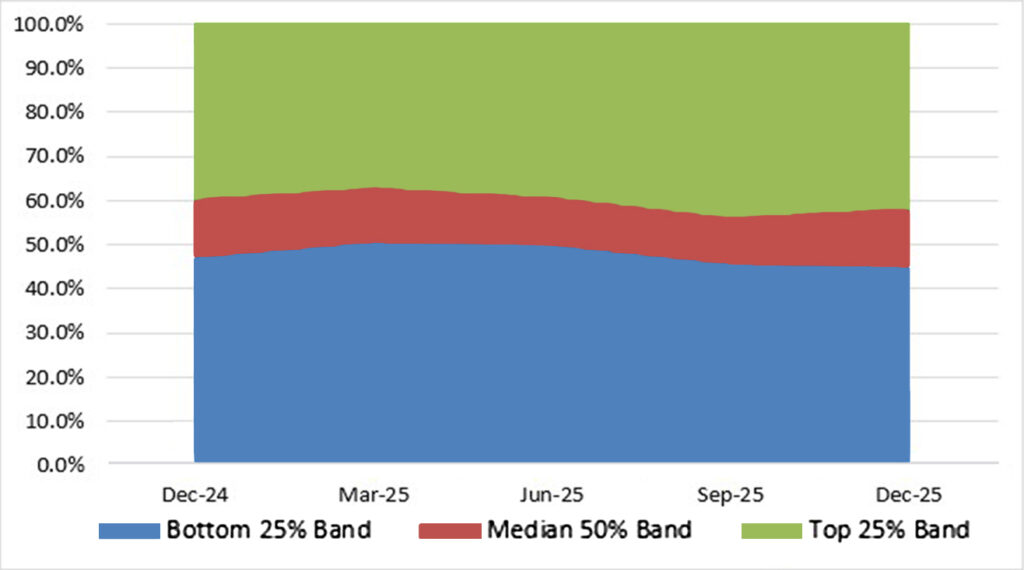
Hours Utilization: ~50% median, stable within ±2.3 percentage points across the measurement period.
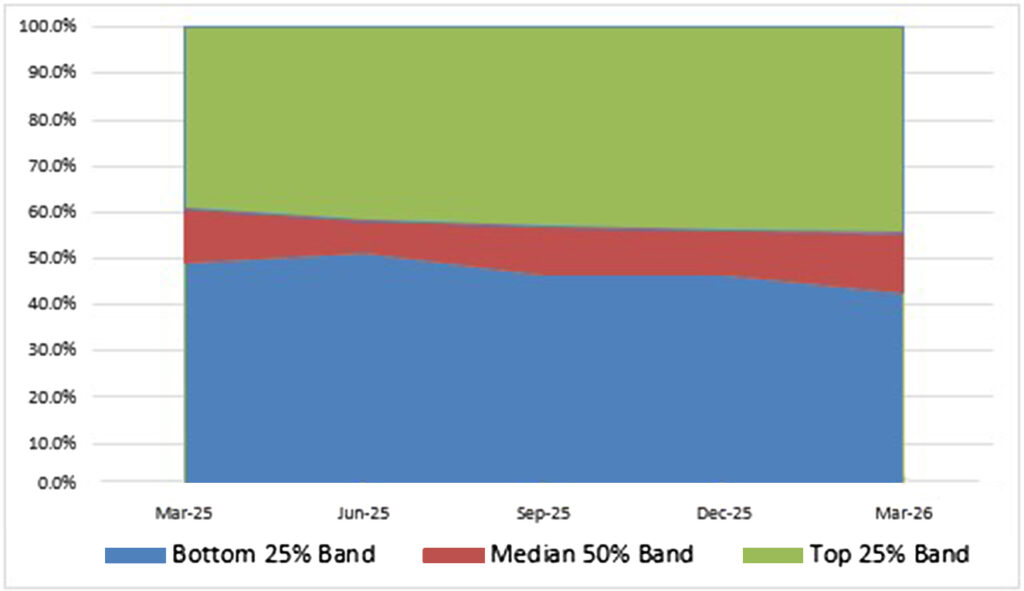
Dollar Utilization: Declining across all quartiles over the same period.
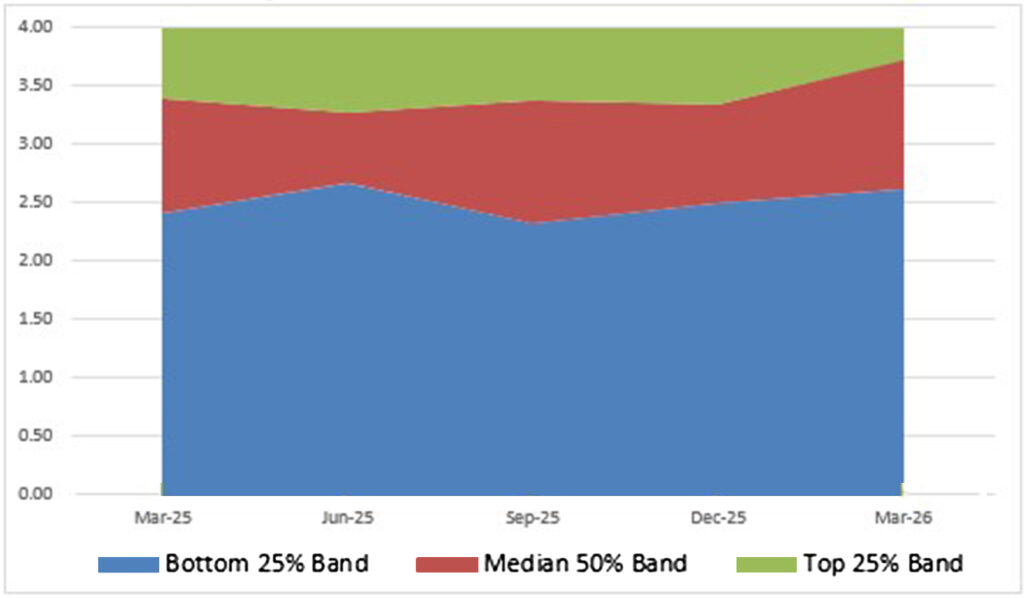
Labor Multiplier: Rising — revenue generated per dollar of labor cost trended upward through 2025.
Three Metrics, One Story
Across CSIA participating firms, hours-based utilization — the share of total labor capacity applied to billable work — held remarkably steady from Q4 2024 through Q4 2025.
Median values remained just above 50% throughout, with a range of only 2.3 percentage points over the entire period.
By that single measure, the industry picture appears stable. The fuller picture, however, is more nuanced. Placed alongside the dollar-based utilization data and the labor multiplier, the Pulse results describe an industry maintaining activity levels while experiencing a gradual compression in revenue quality — a signal that merits closer examination at the firm level.
Hours are Holding Steady. Revenue Quality, Measured in Dollars, is Not
The hours-based utilization metric was designed to show how effectively a firm’s total labor capacity is being directed toward billable work.
Its stability across the measurement period aligns with broader overcapacity patterns reported in EZ Stats — suggesting that member firms may, on average, be expanding capacity modestly relative to demand, as indicated by slight downward drifts in both top and bottom quartile values.
Dollar-based utilization tells a different story. While hours stayed flat, dollar-based utilization declined across all quartiles over the same period.
This divergence indicates that firms are maintaining activity levels, but their higher-cost resources are being utilized less than lower-cost ones.
Possible explanations include:
* An increased use of junior staff on billable projects,
* Retention of senior personnel during softer demand periods, or
* Senior staff spend more time on sales and client retention activities that do not appear on the billing ledger.
Counterpoint
The labor multiplier — revenue generated per dollar of labor cost — offers a partial counterpoint. This metric trended gradually upward through 2025, suggesting that margins on labor are improving even as overall revenue relative to hours worked softens. The work being taken on may be priced more favorably, or firms may have become more disciplined about managing their cost base.
Summary Finding
Margins on labor are increasing, but overall revenue is declining relative to labor hours. This pattern suggests SIs are either:
* Taking on higher-value projects,
* Staffing projects with lower-cost labor, or
* Some combination of both — with the mix varying meaningfully by firm.
Why Submitting Your Data to Pulse Matters
The aggregate trends described above are only possible because member firms contribute their own operational data to the survey.
The more firms that participate, the more precise and representative the benchmarks become — and the more useful the results are for every integrator that relies on them.
What Does This Mean for Your Firm?
But participation is not purely altruistic. Companies that submit their data receive something in return: the ability to compare their own performance directly against industry distribution, not just read about it in aggregate.
If your firm submits data to Pulse, the aggregate results become a reference point for interpreting your own numbers.
Here are the questions the current survey results are well-positioned to help answer at the firm level:
1. Is your hours utilization above or below the median?
The industry median sits just above 50%. If your firm’s rate is meaningfully higher or lower, that context matters — it may indicate relative over- or under-capacity compared to peers, which affects hiring, pricing, and project intake decisions.
2. Are your hours and dollar utilization moving together?
If your hours utilization is stable but your dollar utilization is declining, the same dynamic playing out across the industry may be occurring in your firm — and your data can help pinpoint whether it’s a staffing mix issue, a sales-capacity tradeoff, or a pricing concern.
3. How does your labor multiplier trend compare to the industry?
If your multiplier is growing faster than the industry trend, your firm may be capturing project value or managing costs more effectively than peers. If it’s lagging, there may be room to examine how projects are scoped and priced relative to what’s winning in the market.
4. Where do you fall in the quartile bands?
Consistently performing in the top quartile on a given metric is informative. So is trending from the median toward the bottom quartile. Knowing your position — and how it shifts over time — gives you a more objective basis for evaluating operational decisions.
5. Is your capacity expanding relative to demand?
The slight downward trend in industry, quartile values suggests aggregate capacity may be growing faster than billable demand. Comparing your own capacity trajectory against that backdrop can help calibrate hiring plans and bench tolerance for the quarters ahead.
Bottom line
The Pulse survey is one of the more precise instruments available to SIs for evaluating operational performance against industry peers.
The current results do not indicate a sector-wide crisis, but they do surface meaningful divergences between activity and revenue quality that are worth examining at the firm level — particularly for organizations that rely on senior technical staff as a primary driver of billing.
By participating in this survey, you are better positioned to use these findings as a genuine diagnostic tool rather than a general industry summary.
For more information about Pulse, including how you can access, contribute and benchmark, visit this page.
Source: PULSE Survey: Summary of Results, Q4 2024–Q1 2026. This report reflects an analysis of all PULSE metric data submitted by participating system integrators from Q1 2025 through Q1 2026. For each metric and reporting period, submissions were segmented into lower, middle, and upper quartiles to provide a clear view of performance distribution. In instances where significant outliers appeared, CSIA contacted the submitting member to verify the data, and corrections were made as needed. As a result, the dataset used in this report is free of unverified or extreme anomalies.